Introduction
While less dramatic than a security access breach, a high FRR can render a billion-dollar security investment operationally useless. Understanding, measuring, and optimizing this rate is therefore not just a technical exercise; it is a fundamental pillar of a successful security strategy. To truly grasp its significance, we need to delve into the core FRR meaning.
What is FRR (False Rejection Rate)?
The False Rejection Rate (FRR), also known as a Type I error, is a metric that measures the probability that an authorized user will be incorrectly denied access by a biometric system. It is expressed as a percentage. Understanding the FRR meaning is crucial for anyone involved in biometric security.
For example, a system with a 1% FRR means that for every 100 valid attempts, one will be incorrectly rejected. For a device you use daily, even a low percentage can quickly become a source of major frustration. A high FRR leads to long queues, user complaints, and a loss of faith in the security system.
Think of FRR as a system being overly cautious. It has a stored template of your biometric data (e.g., your fingerprint) and rejects anything that isn't a near-perfect match, even if the variation is natural, like having a slightly wet or cold finger.
The Role of FRR in Access Control Systems
Every access control system must effectively address two core security challenges. The first is identifying and blocking imposters – a failure here leads to a security breach. The second, and equally vital, is reliably recognizing authorized personnel. A failure in this area doesn't trigger alarms but leads to systemic inefficiencies. Authorized individuals are repeatedly inconvenienced, causing operational friction and eroding trust in the system.
This operational friction, where authorized people are incorrectly denied access, is precisely what the False Rejection Rate (FRR) measures. While less immediately dramatic than a security breach, a consistently high FRR can significantly undermine the effectiveness and user acceptance of a security investment. Understanding, measuring, and optimizing this rate is therefore fundamental to a successful security strategy.
FRR vs. FAR: The Biometric Trade-Off

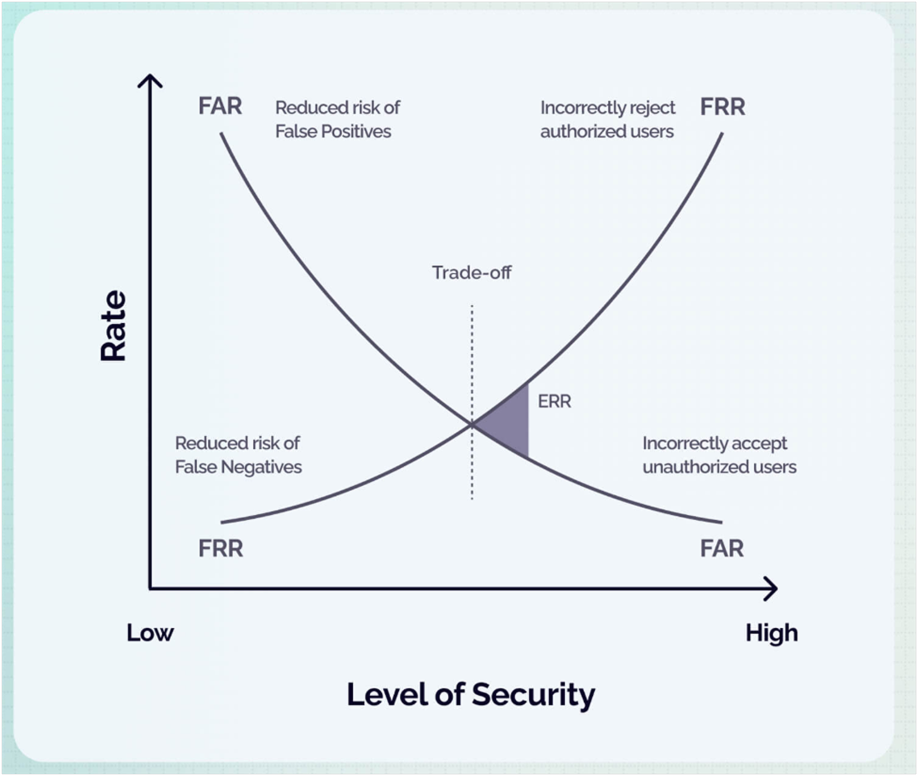
Trade-off between the False Rejection Rate (FRR) and the False Acceptance Rate (FAR) in biometric systems.
This graph illustrates the inherent trade-off between the False Rejection Rate (FRR) and the False Acceptance Rate (FAR) in biometric systems, demonstrating how they inversely relate as the system's security threshold is adjusted.
Lower Security Settings:
At these settings, the FRR is low (fewer legitimate users are rejected), but the FAR is high (more impostors might be accepted).
Higher Security Settings:
Conversely, with higher security settings, the FAR drops (fewer impostors get through), but the FRR rises (more genuine users are blocked).
Every biometric system must balance these two competing error rates. This balance is controlled by a configurable "security threshold." The point where the two curves intersect is known as the Equal Error Rate (EER), representing the system's overall accuracy where FRR and FAR are equivalent. A lower EER signifies a more accurate and reliable system. While achieving a 0% EER is practically impossible, the goal for designers is to minimize it.
FRR Formula and Calculation
Calculating FRR is straightforward once you have the necessary data from a series of biometric access attempts.
FRR Formula:
FRR (%) = (Number of False Rejections / Total Number of Legitimate Attempts) × 100

FRR formula provides a clear, quantifiable measure of user inconvenience and system reliability.
Where:
Number of False Rejections: Occurrences where an authorized user was incorrectly denied access.
Total Number of Legitimate Attempts: The total number of times authorized users attempted to gain access.
Example Calculation:
Imagine a biometric access system at an office building. Over a week, 1,000 legitimate employees attempted to use the system. Out of these 1,000 attempts, the system incorrectly denied access to authorized employees 15 times.
Using the formula:
FRR = (15 / 1,000) × 100
FRR = 0.015 × 100
FRR = 1.5%
This means that 1.5% of the time, an authorized employee faced a false rejection. This calculation provides a clear, quantifiable measure of user inconvenience and system reliability.
What is a Good False Rejection Rate?
What qualifies as a "good" FRR depends entirely on the application. According to NIST's ongoing Face Recognition Vendor Test (FRVT), the best algorithms demonstrate an FRR below 0.2% on high-quality portraits. The practical FRR meaning here is that fewer than 1 in 500 valid attempts would fail. Top-tier fingerprint algorithms show a similar performance, often achieving an FRR of less than 0.5% on good quality prints.
Here are some practical benchmarks:
An FRR of up to 5% might be acceptable if it means achieving a near-zero FAR. Security is paramount.
An FRR below 1% is considered excellent. Anything above 2-3% will lead to employee complaints and hinder productivity.
Users expect near-instant access, so manufacturers aim for an FRR well below 1%, often accepting a slightly higher FAR as a trade-off.
What Causes a High FRR?
If you're experiencing frequent false rejections, it's typically due to one of three factors:
1. Poor Hardware Quality
Low-resolution cameras, smudged fingerprint scanners, or readers not suited for outdoor conditions (e.g., rain, bright sunlight) can fail to capture a clear biometric sample.
2. Bad Enrollment Template
The initial scan used to enroll a user is critical. A rushed, poorly lit, or smudged enrollment creates a low-quality template that the system will struggle to match later.
3. User and Environmental Changes
Biometrics are not static. A high FRR can be caused by:

"Template Aging" -
Minor changes over time, like a new scar on a finger, weight loss affecting facial structure, or dry skin, can create a mismatch.

User Behavior -
The user looking away from a camera, not placing their finger correctly, or speaking too softly into a voice system.

Environmental Factors -
Different lighting, loud background noise, or even wearing a hat can affect system performance.
The Bottom Line
Evaluating a biometric system based solely on its False Acceptance Rate (FAR) is a critical oversight. A vendor promoting a near-zero FAR might be concealing a high FRR, which could render the system operationally ineffective. The optimal strategy involves first defining your maximum acceptable security risk (FAR) and then selecting a system that achieves the lowest possible FRR within those security constraints. While a security breach (high FAR) is a significant event, constant user lockouts (high FRR) can severely impact productivity and user adoption. The most effective system strikes the right balance for your specific organizational needs.
Comments